使用Prometheus Operator实现应用自定义监控
閱讀本文約花費: 9 (分鐘)
一、前言
在之前文章中为大家讲解了如何在Kubernetes集群中部署Prometheus,已经可以通过Prometheus监控Kubernetes中Pod的状态、核心组件的状态等数据。那么如何将应用自身的数据进行集成呢?
首先prometheus对收集的数据格式是有一定的要求的,具体格式如下,只有符合此格式的prometheus才会正常的采集,所以在应用中我们需要能把关键性的监控数据以此格式抛出来。
nginx_http_connections{state="active"} 2
nginx_http_connections{state="reading"} 0
nginx_http_connections{state="waiting"} 1
nginx_http_connections{state="writing"} 1
nginx_http_request_bytes_sent{host="10.46.0.4"} 11055968
nginx_http_request_bytes_sent{host="testservers"} 4640
nginx_http_request_time_bucket{host="10.46.0.4",le="00.005"} 3960
...
至于怎么把监控指标数据抛出来,可能需要从应用本身动手。Prometheus社区也提供了大量的官方以及第三方Exporters,可以满足Prometheus的采纳者快速实现对关键业务,以及基础设施的监控需求。
官方以及第三方Exporters请参考此链接。
此处我们建议直接使用Prometheus的Client进行注册监控接口。Promehtues的Client目前支持大部分编程语言,支持列表可以参考如下文章。
prometheus client支持的语言列表。
二、应用监控
本次是使用nginx demo镜像来演示。
1. 创建deployment和service
apiVersion: apps/v1beta1
kind: Deployment
metadata:
  name: nginx-demo
  labels:
    app: nginx-demo
spec:
  replicas: 1
  selector:
    matchLabels:
      app: nginx-demo
  template:
    metadata:
      labels:
        app: nginx-demo
    spec:
      containers:
      - name: nginx-demo
        image: billy98/nginx-prometheus-metrics:latest
        ports:
        - name: http-metrics
          containerPort: 9527
        - name: web
          containerPort: 80
        - name: test
          containerPort: 1314
        imagePullPolicy: IfNotPresent
---
apiVersion: v1
kind: Service
metadata:
  labels:
    app: nginx-demo
  name: nginx-demo
  namespace: default
spec:
  ports:
  - name: http-metrics
    port: 9527
    protocol: TCP
    targetPort: 9527
  - name: web
    port: 80
    protocol: TCP
    targetPort: 80
  - name: test
    port: 1314
    protocol: TCP
    targetPort: 1314
  selector:
    app: nginx-demo
  type: ClusterIP
2. 创建ServiceMonitor
由于prometheus里指定了serviceMonitor的标签必须release: p才会去抓取数据,所以在我们应用的ServiceMonitor中必须加上此标签。
[root@node-01 ~]# kubectl -n monitoring get prometheus p-prometheus -o yaml

...
  serviceMonitorSelector:
    matchLabels:
      release: p
...(其余内容省略)
apiVersion: monitoring.coreos.com/v1
kind: ServiceMonitor
metadata:
  labels:
    app: nginx-demo
    release: p
  name: nginx-demo
  namespace: monitoring
  #prometheus的namespace
spec:
  endpoints:
  - interval: 15s
    port: http-metrics
  namespaceSelector:
    matchNames:
    - default
    #nginx demo的namespace
  selector:
    matchLabels:
      app: nginx-demo
此处需要特别做些解释,serviceMonitor是Prometheus Operator中抽象的概念,他的作用就是讲配置Prometheus采集Target的配置变化成为动态发现的方式,可以serviceMonitor通过Deployment对应的Service配置进行挂钩,通过label selector选择Service,并自动发现后端容器。其中需要注意的是namespace字段永远为monitoring,而namespaceSelector中则是选择的应用所在的namespace。
创建完成可以看到endpoints
[root@node-01 ~]# kubectl get ep
NAME                       ENDPOINTS                                      AGE
heketi                     10.45.0.3:8080                                 36d
heketi-storage-endpoints   10.31.90.204:1,10.31.90.205:1,10.31.90.206:1   36d
kubernetes                 10.31.90.201:6443                              38d
nginx-demo                 10.46.0.4:9527,10.46.0.4:80,10.46.0.4:1314     6h
tomcat                     10.34.0.0:8080                                 38d
然后我们访问10.46.0.4:1314,生成一些测试指标。
[root@node-01 ~]# curl 10.46.0.4:1314
hello world
访问10.46.0.4:9527/metrics,查看监控数据
[root@node-01 ~]# curl 10.46.0.4:9527/metrics
# HELP nginx_http_connections Number of HTTP connections
# TYPE nginx_http_connections gauge
nginx_http_connections{state="active"} 2
nginx_http_connections{state="reading"} 0
nginx_http_connections{state="waiting"} 1
nginx_http_connections{state="writing"} 1
# HELP nginx_http_request_bytes_sent Number of HTTP request bytes sent
# TYPE nginx_http_request_bytes_sent counter
nginx_http_request_bytes_sent{host="10.46.0.4"} 16885674
nginx_http_request_bytes_sent{host="testservers"} 4800
# HELP nginx_http_request_time HTTP request time
# TYPE nginx_http_request_time histogram
nginx_http_request_time_bucket{host="10.46.0.4",le="00.005"} 4437
nginx_http_request_time_bucket{host="10.46.0.4",le="00.010"} 4437
nginx_http_request_time_bucket{host="10.46.0.4",le="00.020"} 4437
nginx_http_request_time_bucket{host="10.46.0.4",le="00.030"} 4437
nginx_http_request_time_bucket{host="10.46.0.4",le="00.050"} 4437
nginx_http_request_time_bucket{host="10.46.0.4",le="00.075"} 4437
nginx_http_request_time_bucket{host="10.46.0.4",le="00.100"} 4437
nginx_http_request_time_bucket{host="10.46.0.4",le="00.200"} 4437
nginx_http_request_time_bucket{host="10.46.0.4",le="00.300"} 4437
nginx_http_request_time_bucket{host="10.46.0.4",le="00.400"} 4437
nginx_http_request_time_bucket{host="10.46.0.4",le="00.500"} 4437
nginx_http_request_time_bucket{host="10.46.0.4",le="00.750"} 4437
nginx_http_request_time_bucket{host="10.46.0.4",le="01.000"} 4437
nginx_http_request_time_bucket{host="10.46.0.4",le="01.500"} 4437
nginx_http_request_time_bucket{host="10.46.0.4",le="02.000"} 4437
nginx_http_request_time_bucket{host="10.46.0.4",le="03.000"} 4443
nginx_http_request_time_bucket{host="10.46.0.4",le="04.000"} 4443
nginx_http_request_time_bucket{host="10.46.0.4",le="05.000"} 4443
nginx_http_request_time_bucket{host="10.46.0.4",le="10.000"} 4443
nginx_http_request_time_bucket{host="10.46.0.4",le="+Inf"} 4443
nginx_http_request_time_bucket{host="testservers",le="00.005"} 30
nginx_http_request_time_bucket{host="testservers",le="00.010"} 30
nginx_http_request_time_bucket{host="testservers",le="00.020"} 30
nginx_http_request_time_bucket{host="testservers",le="00.030"} 30
nginx_http_request_time_bucket{host="testservers",le="00.050"} 30
nginx_http_request_time_bucket{host="testservers",le="00.075"} 30
nginx_http_request_time_bucket{host="testservers",le="00.100"} 30
nginx_http_request_time_bucket{host="testservers",le="00.200"} 30
nginx_http_request_time_bucket{host="testservers",le="00.300"} 30
nginx_http_request_time_bucket{host="testservers",le="00.400"} 30
nginx_http_request_time_bucket{host="testservers",le="00.500"} 30
nginx_http_request_time_bucket{host="testservers",le="00.750"} 30
nginx_http_request_time_bucket{host="testservers",le="01.000"} 30
nginx_http_request_time_bucket{host="testservers",le="01.500"} 30
nginx_http_request_time_bucket{host="testservers",le="02.000"} 30
nginx_http_request_time_bucket{host="testservers",le="03.000"} 30
nginx_http_request_time_bucket{host="testservers",le="04.000"} 30
nginx_http_request_time_bucket{host="testservers",le="05.000"} 30
nginx_http_request_time_bucket{host="testservers",le="10.000"} 30
nginx_http_request_time_bucket{host="testservers",le="+Inf"} 30
nginx_http_request_time_count{host="10.46.0.4"} 4443
nginx_http_request_time_count{host="testservers"} 30
nginx_http_request_time_sum{host="10.46.0.4"} 12.044999361038
nginx_http_request_time_sum{host="testservers"} 0
# HELP nginx_http_requests Number of HTTP requests
# TYPE nginx_http_requests counter
nginx_http_requests{host="10.46.0.4",status="200"} 4443
nginx_http_requests{host="testservers",status="200"} 30
# HELP nginx_http_upstream_bytes_received Number of HTTP upstream bytes received
# TYPE nginx_http_upstream_bytes_received counter
nginx_http_upstream_bytes_received{addr="10.12.13.14:80"} 0
nginx_http_upstream_bytes_received{addr="127.0.0.1:80"} 4800
# HELP nginx_http_upstream_connect_time HTTP upstream connect time
# TYPE nginx_http_upstream_connect_time histogram
nginx_http_upstream_connect_time_bucket{addr="10.12.13.14:80",le="03.000"} 6
nginx_http_upstream_connect_time_bucket{addr="10.12.13.14:80",le="04.000"} 6
nginx_http_upstream_connect_time_bucket{addr="10.12.13.14:80",le="05.000"} 6
nginx_http_upstream_connect_time_bucket{addr="10.12.13.14:80",le="10.000"} 6
nginx_http_upstream_connect_time_bucket{addr="10.12.13.14:80",le="+Inf"} 6
nginx_http_upstream_connect_time_bucket{addr="127.0.0.1:80",le="00.005"} 30
nginx_http_upstream_connect_time_bucket{addr="127.0.0.1:80",le="00.010"} 30
nginx_http_upstream_connect_time_bucket{addr="127.0.0.1:80",le="00.020"} 30
nginx_http_upstream_connect_time_bucket{addr="127.0.0.1:80",le="00.030"} 30
nginx_http_upstream_connect_time_bucket{addr="127.0.0.1:80",le="00.050"} 30
nginx_http_upstream_connect_time_bucket{addr="127.0.0.1:80",le="00.075"} 30
nginx_http_upstream_connect_time_bucket{addr="127.0.0.1:80",le="00.100"} 30
nginx_http_upstream_connect_time_bucket{addr="127.0.0.1:80",le="00.200"} 30
nginx_http_upstream_connect_time_bucket{addr="127.0.0.1:80",le="00.300"} 30
nginx_http_upstream_connect_time_bucket{addr="127.0.0.1:80",le="00.400"} 30
nginx_http_upstream_connect_time_bucket{addr="127.0.0.1:80",le="00.500"} 30
nginx_http_upstream_connect_time_bucket{addr="127.0.0.1:80",le="00.750"} 30
nginx_http_upstream_connect_time_bucket{addr="127.0.0.1:80",le="01.000"} 30
nginx_http_upstream_connect_time_bucket{addr="127.0.0.1:80",le="01.500"} 30
nginx_http_upstream_connect_time_bucket{addr="127.0.0.1:80",le="02.000"} 30
nginx_http_upstream_connect_time_bucket{addr="127.0.0.1:80",le="03.000"} 30
nginx_http_upstream_connect_time_bucket{addr="127.0.0.1:80",le="04.000"} 30
nginx_http_upstream_connect_time_bucket{addr="127.0.0.1:80",le="05.000"} 30
nginx_http_upstream_connect_time_bucket{addr="127.0.0.1:80",le="10.000"} 30
nginx_http_upstream_connect_time_bucket{addr="127.0.0.1:80",le="+Inf"} 30
nginx_http_upstream_connect_time_count{addr="10.12.13.14:80"} 6
nginx_http_upstream_connect_time_count{addr="127.0.0.1:80"} 30
nginx_http_upstream_connect_time_sum{addr="10.12.13.14:80"} 12.015
nginx_http_upstream_connect_time_sum{addr="127.0.0.1:80"} 0.006
# HELP nginx_http_upstream_header_time HTTP upstream header time
# TYPE nginx_http_upstream_header_time histogram
nginx_http_upstream_header_time_bucket{addr="10.12.13.14:80",le="03.000"} 6
nginx_http_upstream_header_time_bucket{addr="10.12.13.14:80",le="04.000"} 6
nginx_http_upstream_header_time_bucket{addr="10.12.13.14:80",le="05.000"} 6
nginx_http_upstream_header_time_bucket{addr="10.12.13.14:80",le="10.000"} 6
nginx_http_upstream_header_time_bucket{addr="10.12.13.14:80",le="+Inf"} 6
nginx_http_upstream_header_time_bucket{addr="127.0.0.1:80",le="00.005"} 30
nginx_http_upstream_header_time_bucket{addr="127.0.0.1:80",le="00.010"} 30
nginx_http_upstream_header_time_bucket{addr="127.0.0.1:80",le="00.020"} 30
nginx_http_upstream_header_time_bucket{addr="127.0.0.1:80",le="00.030"} 30
nginx_http_upstream_header_time_bucket{addr="127.0.0.1:80",le="00.050"} 30
nginx_http_upstream_header_time_bucket{addr="127.0.0.1:80",le="00.075"} 30
nginx_http_upstream_header_time_bucket{addr="127.0.0.1:80",le="00.100"} 30
nginx_http_upstream_header_time_bucket{addr="127.0.0.1:80",le="00.200"} 30
nginx_http_upstream_header_time_bucket{addr="127.0.0.1:80",le="00.300"} 30
nginx_http_upstream_header_time_bucket{addr="127.0.0.1:80",le="00.400"} 30
nginx_http_upstream_header_time_bucket{addr="127.0.0.1:80",le="00.500"} 30
nginx_http_upstream_header_time_bucket{addr="127.0.0.1:80",le="00.750"} 30
nginx_http_upstream_header_time_bucket{addr="127.0.0.1:80",le="01.000"} 30
nginx_http_upstream_header_time_bucket{addr="127.0.0.1:80",le="01.500"} 30
nginx_http_upstream_header_time_bucket{addr="127.0.0.1:80",le="02.000"} 30
nginx_http_upstream_header_time_bucket{addr="127.0.0.1:80",le="03.000"} 30
nginx_http_upstream_header_time_bucket{addr="127.0.0.1:80",le="04.000"} 30
nginx_http_upstream_header_time_bucket{addr="127.0.0.1:80",le="05.000"} 30
nginx_http_upstream_header_time_bucket{addr="127.0.0.1:80",le="10.000"} 30
nginx_http_upstream_header_time_bucket{addr="127.0.0.1:80",le="+Inf"} 30
nginx_http_upstream_header_time_count{addr="10.12.13.14:80"} 6
nginx_http_upstream_header_time_count{addr="127.0.0.1:80"} 30
nginx_http_upstream_header_time_sum{addr="10.12.13.14:80"} 12.015
nginx_http_upstream_header_time_sum{addr="127.0.0.1:80"} 0.03
# HELP nginx_http_upstream_requests Number of HTTP upstream requests
# TYPE nginx_http_upstream_requests counter
nginx_http_upstream_requests{addr="10.12.13.14:80",status="504"} 6
nginx_http_upstream_requests{addr="127.0.0.1:80",status="200"} 30
# HELP nginx_http_upstream_response_time HTTP upstream response time
# TYPE nginx_http_upstream_response_time histogram
nginx_http_upstream_response_time_bucket{addr="10.12.13.14:80",le="03.000"} 6
nginx_http_upstream_response_time_bucket{addr="10.12.13.14:80",le="04.000"} 6
nginx_http_upstream_response_time_bucket{addr="10.12.13.14:80",le="05.000"} 6
nginx_http_upstream_response_time_bucket{addr="10.12.13.14:80",le="10.000"} 6
nginx_http_upstream_response_time_bucket{addr="10.12.13.14:80",le="+Inf"} 6
nginx_http_upstream_response_time_bucket{addr="127.0.0.1:80",le="00.005"} 30
nginx_http_upstream_response_time_bucket{addr="127.0.0.1:80",le="00.010"} 30
nginx_http_upstream_response_time_bucket{addr="127.0.0.1:80",le="00.020"} 30
nginx_http_upstream_response_time_bucket{addr="127.0.0.1:80",le="00.030"} 30
nginx_http_upstream_response_time_bucket{addr="127.0.0.1:80",le="00.050"} 30
nginx_http_upstream_response_time_bucket{addr="127.0.0.1:80",le="00.075"} 30
nginx_http_upstream_response_time_bucket{addr="127.0.0.1:80",le="00.100"} 30
nginx_http_upstream_response_time_bucket{addr="127.0.0.1:80",le="00.200"} 30
nginx_http_upstream_response_time_bucket{addr="127.0.0.1:80",le="00.300"} 30
nginx_http_upstream_response_time_bucket{addr="127.0.0.1:80",le="00.400"} 30
nginx_http_upstream_response_time_bucket{addr="127.0.0.1:80",le="00.500"} 30
nginx_http_upstream_response_time_bucket{addr="127.0.0.1:80",le="00.750"} 30
nginx_http_upstream_response_time_bucket{addr="127.0.0.1:80",le="01.000"} 30
nginx_http_upstream_response_time_bucket{addr="127.0.0.1:80",le="01.500"} 30
nginx_http_upstream_response_time_bucket{addr="127.0.0.1:80",le="02.000"} 30
nginx_http_upstream_response_time_bucket{addr="127.0.0.1:80",le="03.000"} 30
nginx_http_upstream_response_time_bucket{addr="127.0.0.1:80",le="04.000"} 30
nginx_http_upstream_response_time_bucket{addr="127.0.0.1:80",le="05.000"} 30
nginx_http_upstream_response_time_bucket{addr="127.0.0.1:80",le="10.000"} 30
nginx_http_upstream_response_time_bucket{addr="127.0.0.1:80",le="+Inf"} 30
nginx_http_upstream_response_time_count{addr="10.12.13.14:80"} 6
nginx_http_upstream_response_time_count{addr="127.0.0.1:80"} 30
nginx_http_upstream_response_time_sum{addr="10.12.13.14:80"} 12.015
nginx_http_upstream_response_time_sum{addr="127.0.0.1:80"} 0.03
# HELP nginx_metric_errors_total Number of nginx-lua-prometheus errors
# TYPE nginx_metric_errors_total counter
nginx_metric_errors_total 0
3. 验证
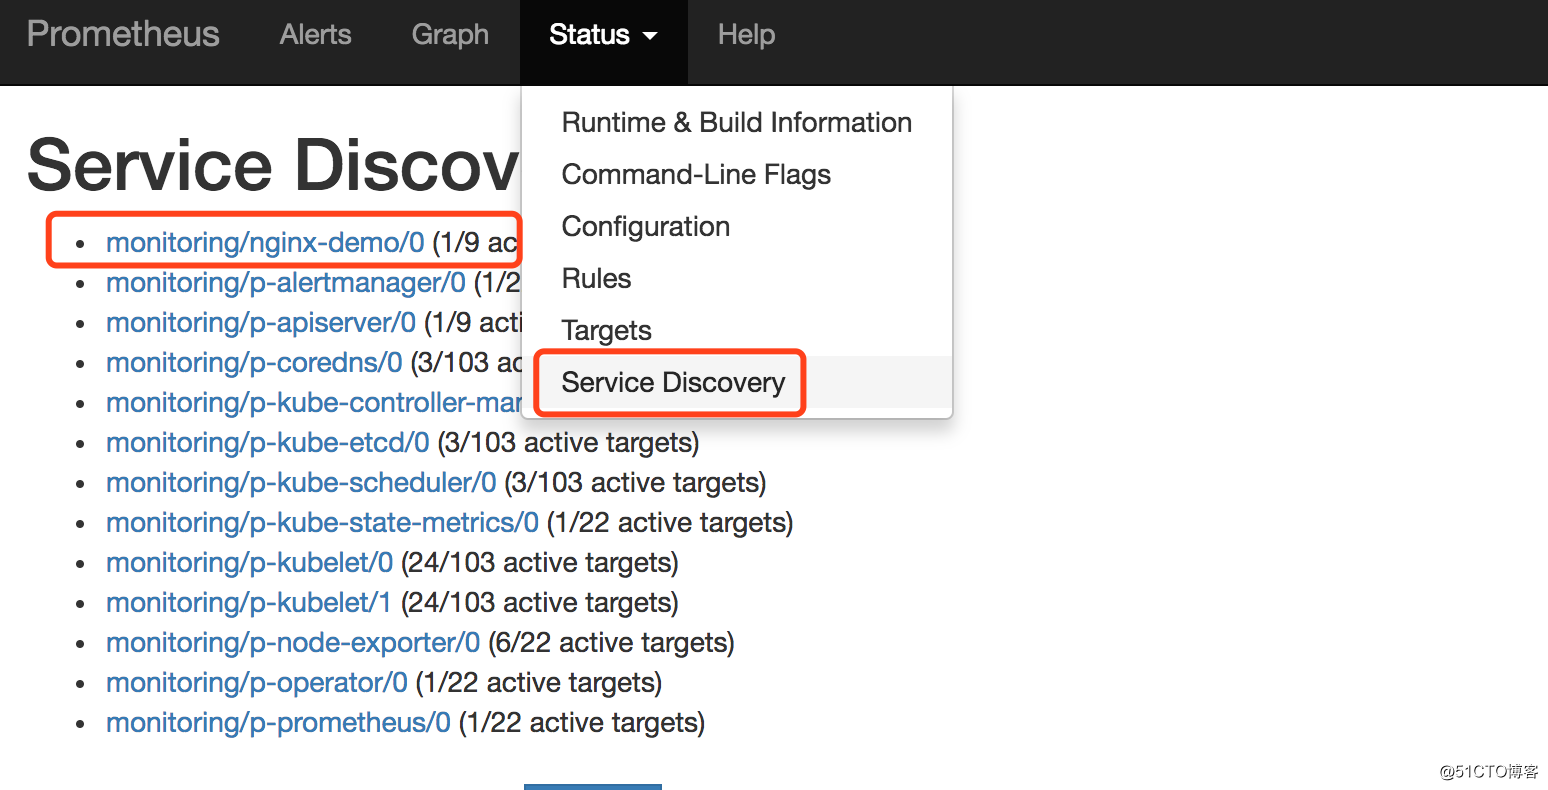
访问Prometheus,验证数据采集,打开Status下的Service Discovery,active的数目等于Pod数据即表示采集正常
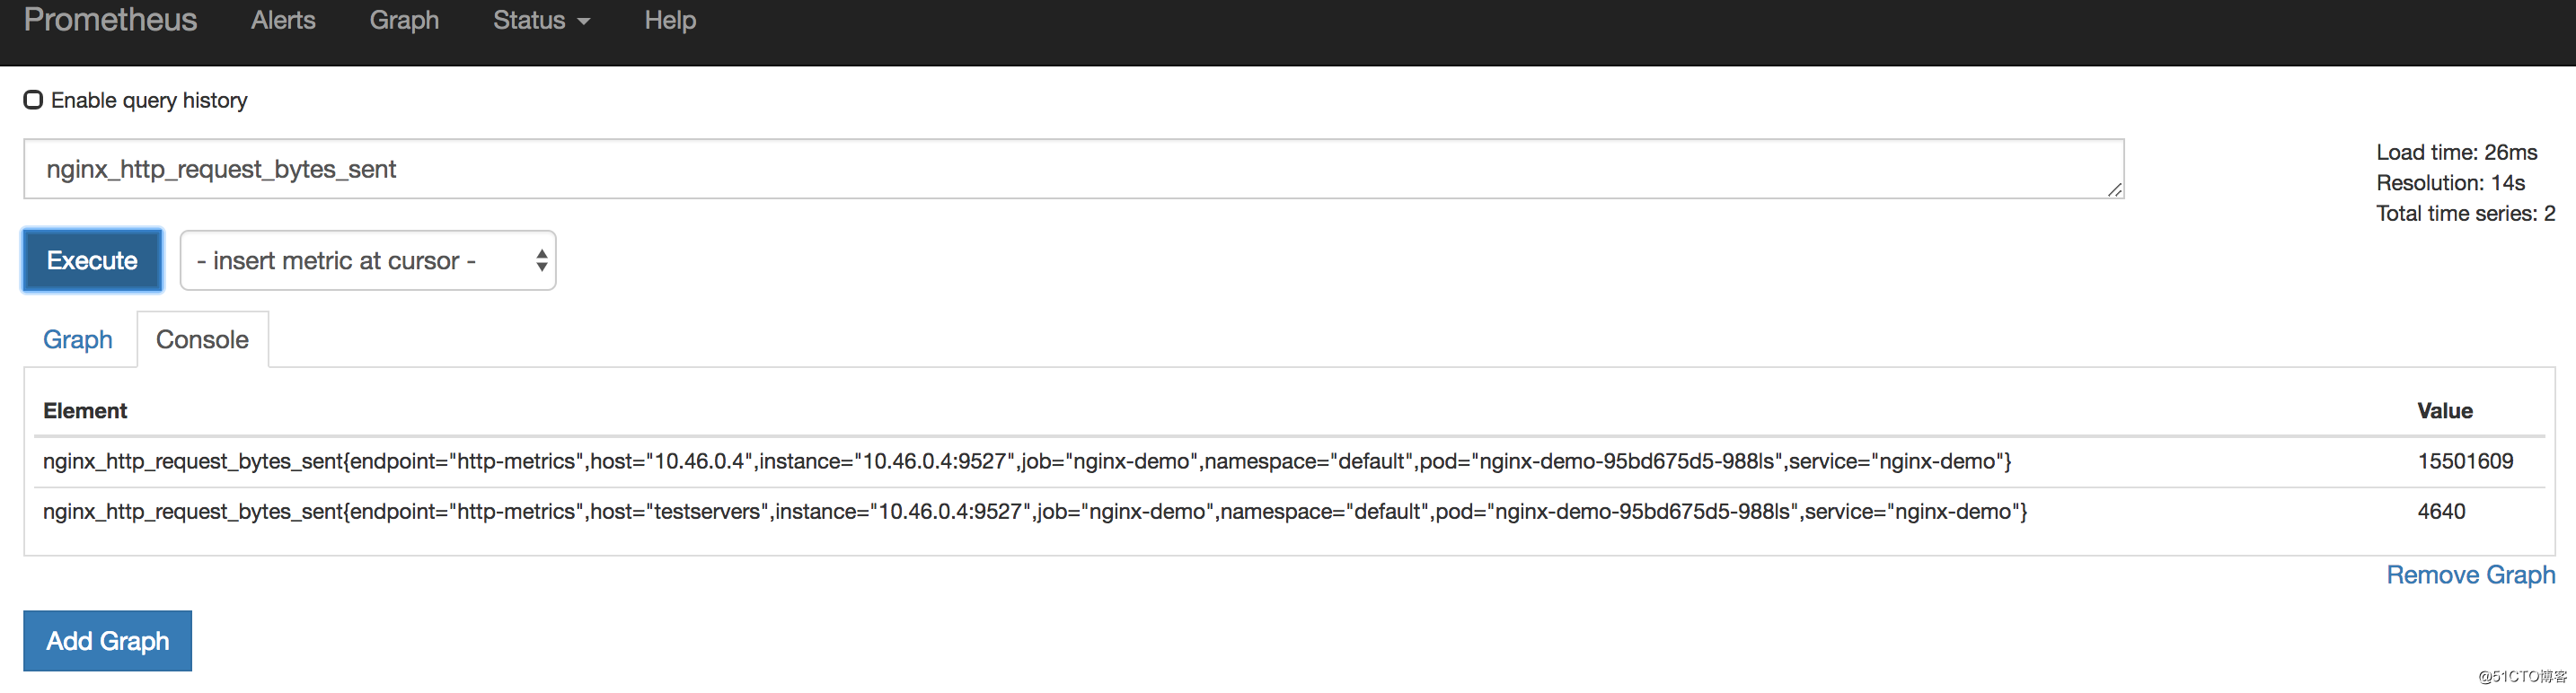
打开Graph页面,选择我们刚才推送的数据指标名称,点击Execute,即可查看到采集上来的数据。prometheus查询语法请参考prometheus查询语句示例。
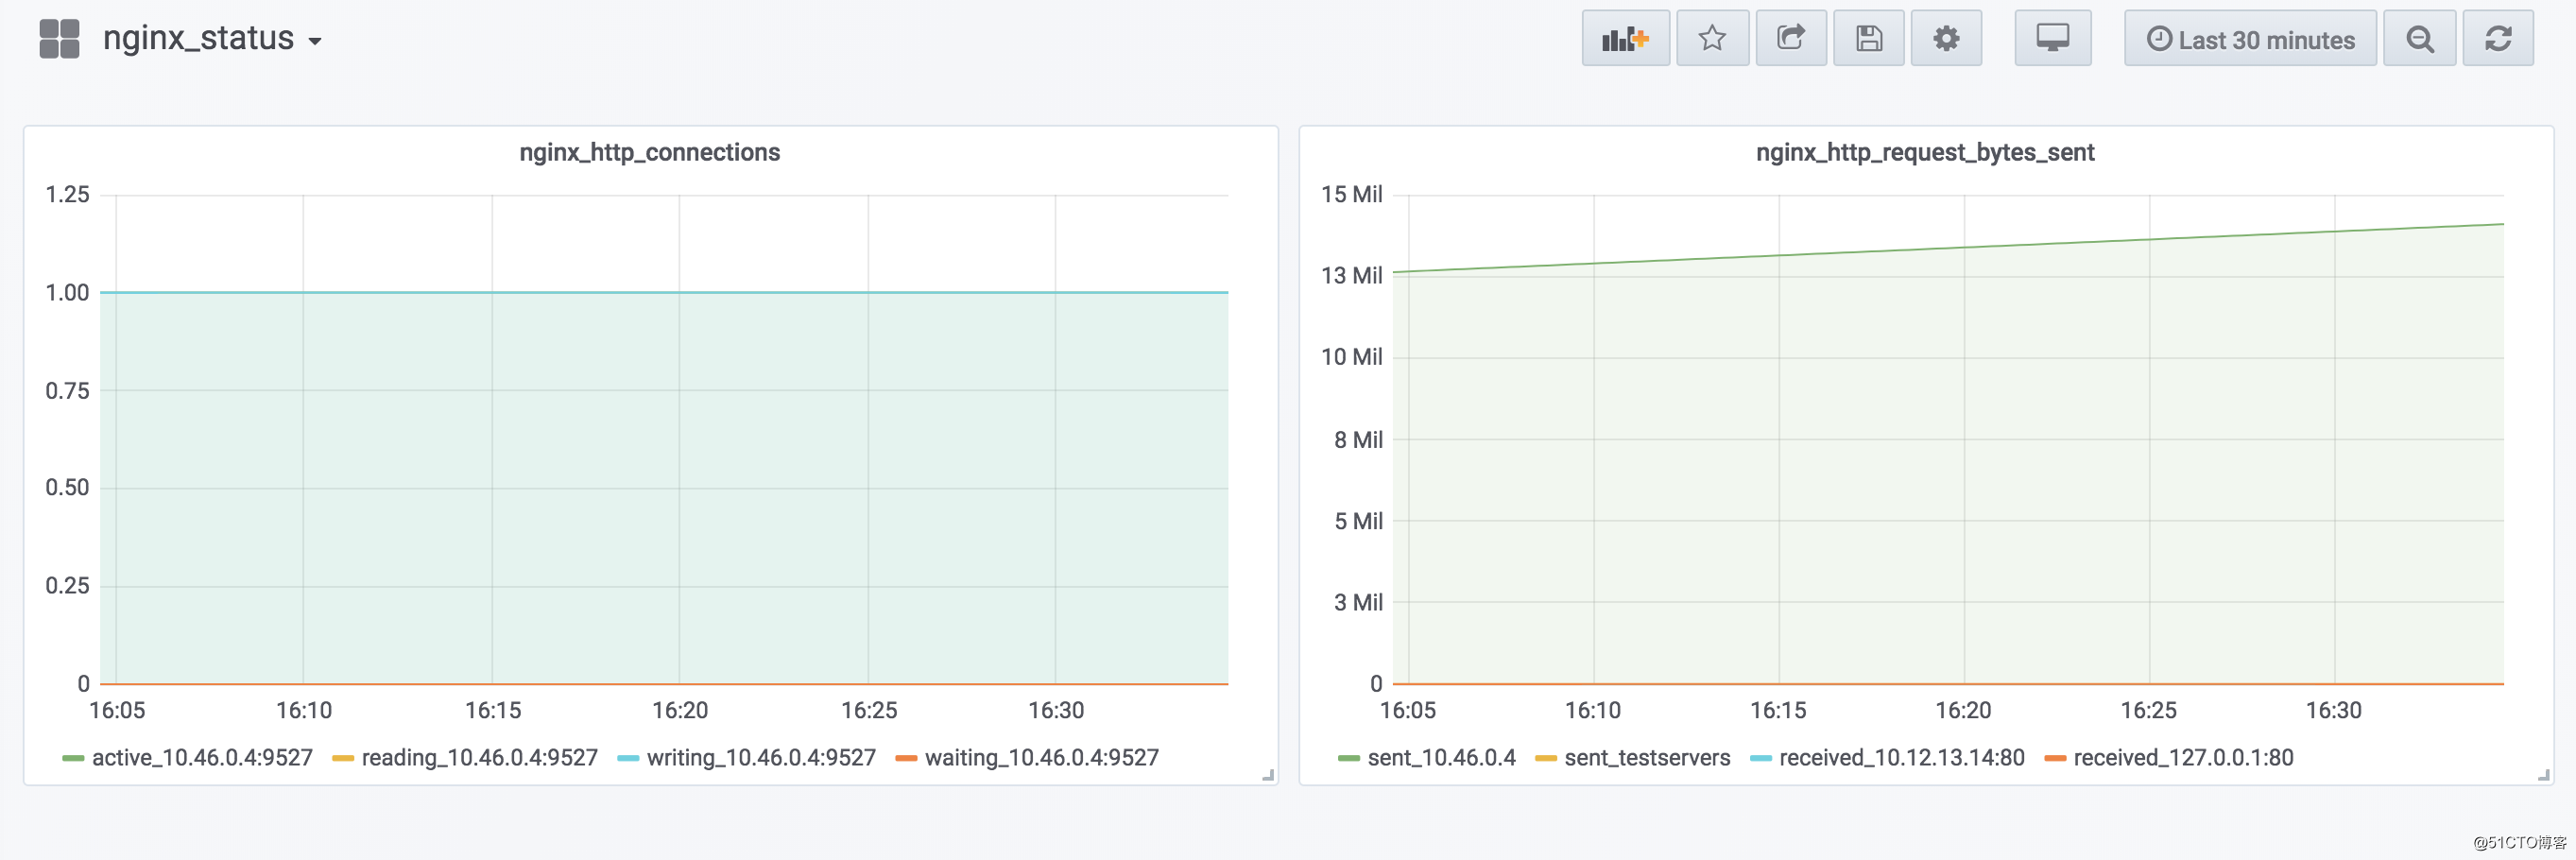
然后我们在grafana中创建一个简单的图表显示nginx的数据。
最后
使用Prometheus接入应用监控的方式非常简单,整个操作的流程非常kubernetes,这也是目前非常多的开源软件和Kubernetes集成的一种方式与趋势,在开发者习惯了之后,会越来越感受到这种方式的便利。
下一篇会讲到使用邮件或者钉钉报警的相关教程。