Linux Performance
閱讀本文約花費: 6 (分鐘)
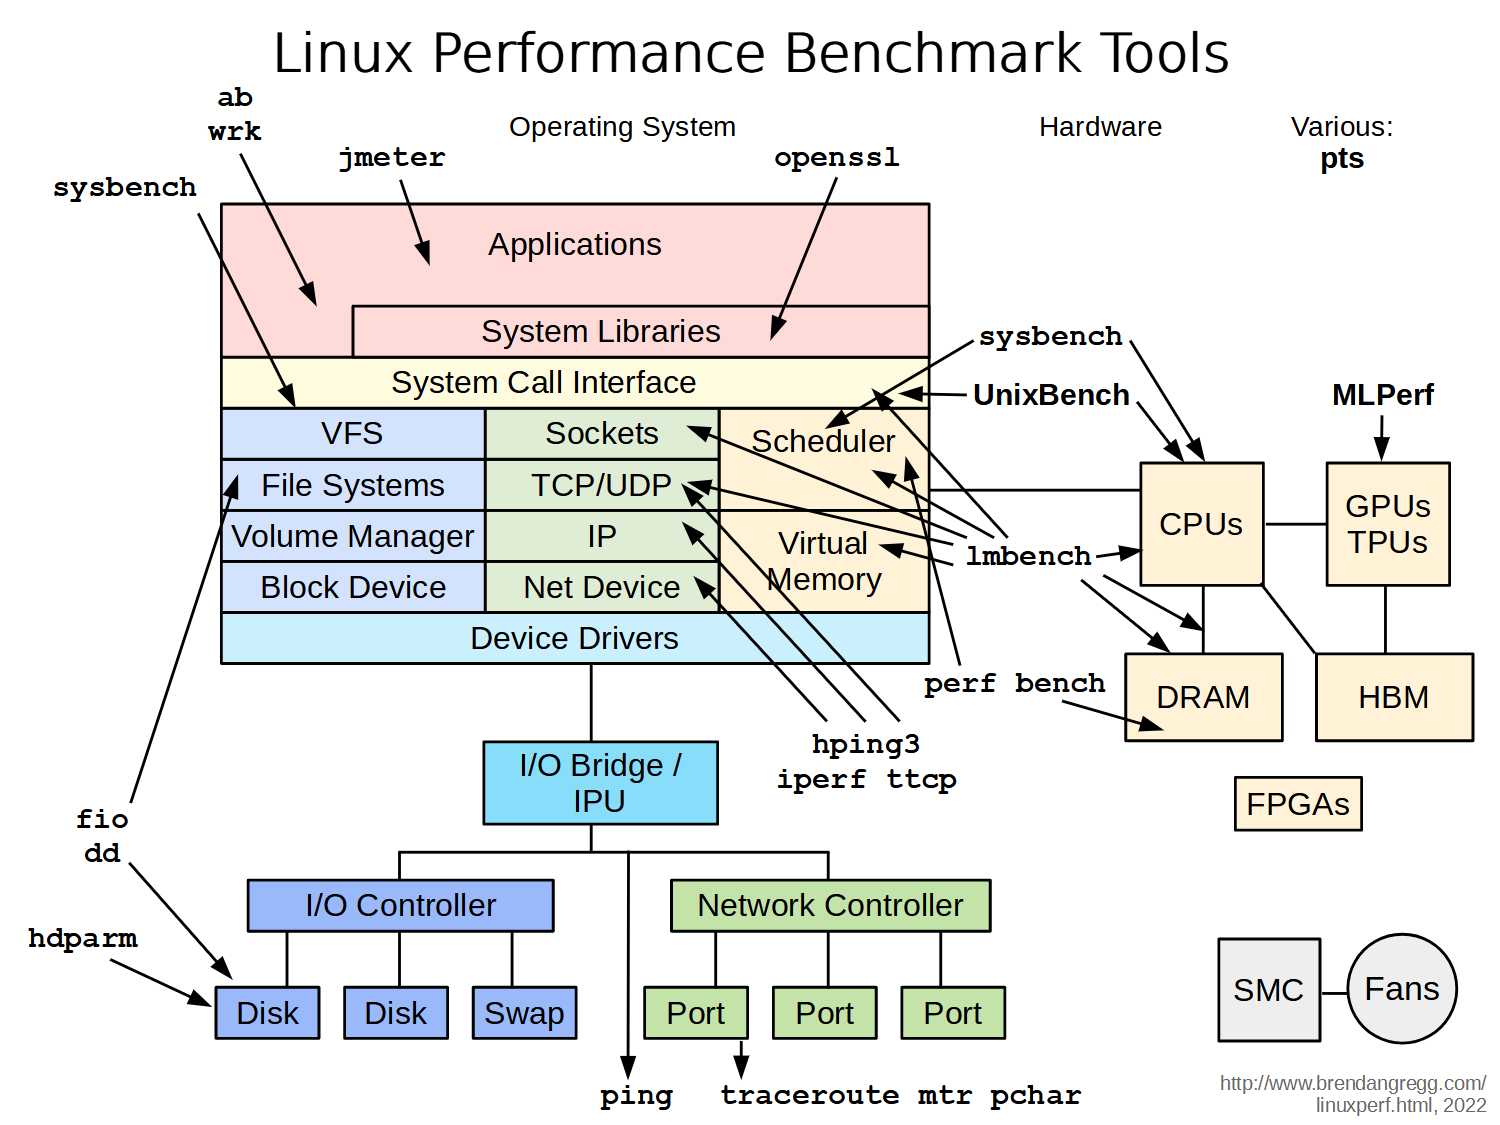
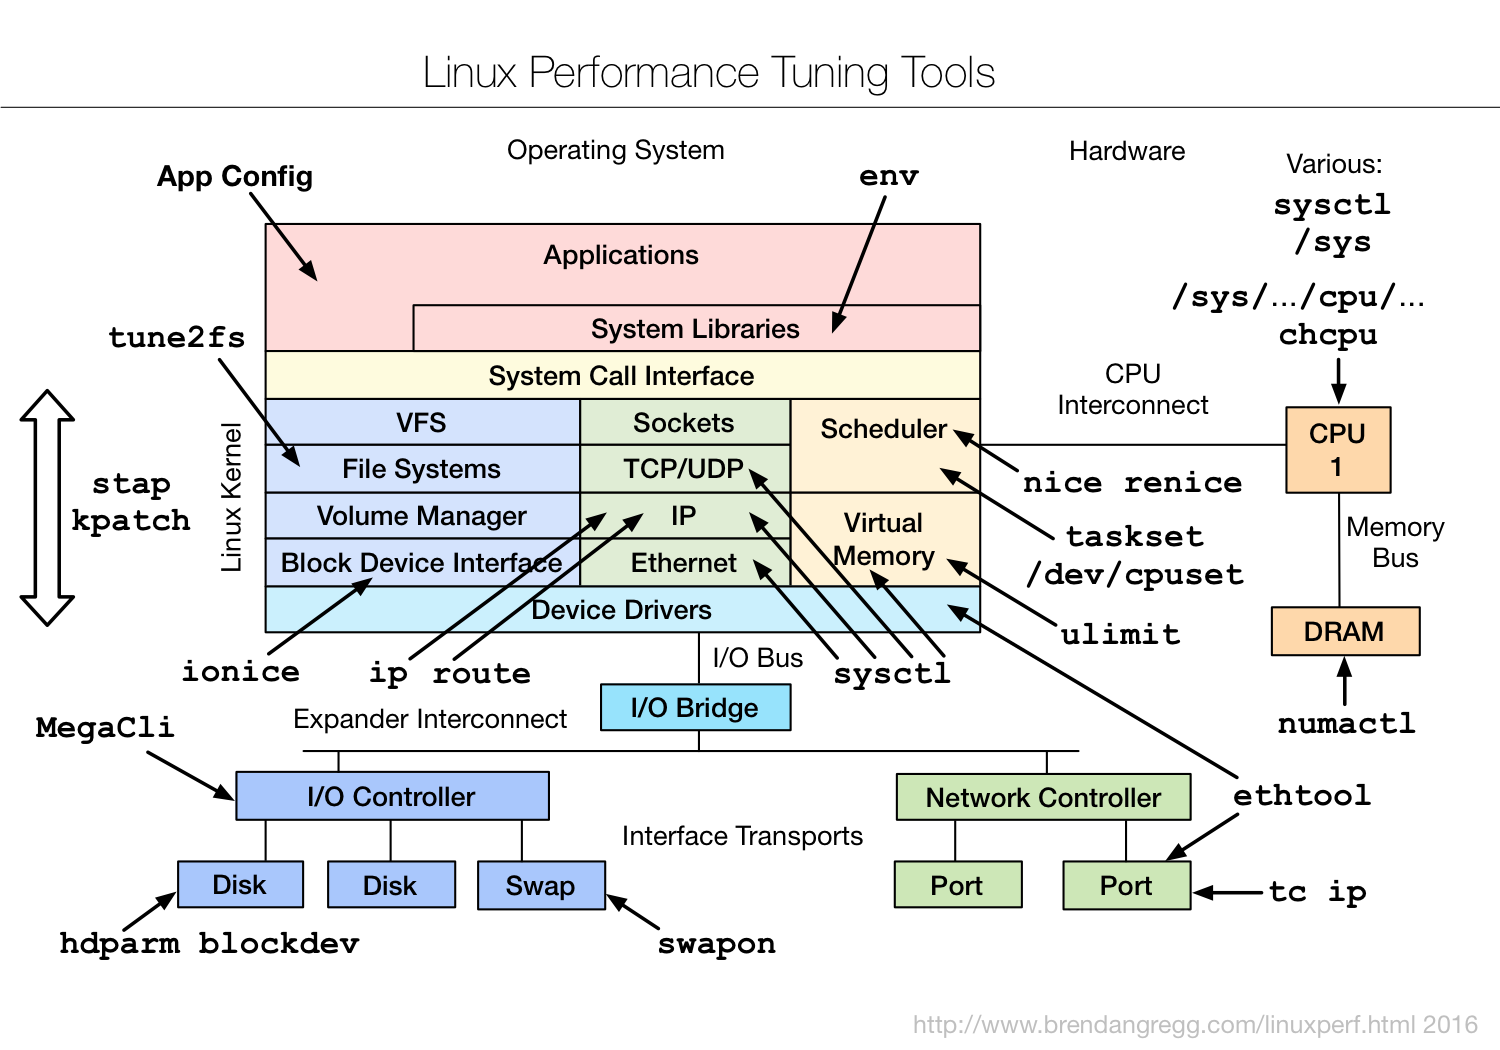
from: http://www.brendangregg.com/linuxperf.html This page links to various Linux performance material I’ve created, including the tools maps on the right. The first is a hi-res version combining observability, static performance tuning, and perf-tools/bcc (see discussion). The remainder were designed for use in slide decks and have larger fonts and arrows, and show: Linux observability tools, Linux benchmarking tools, Linux tuning tools, and Linux sar. For even more diagrams, see my slide decks below.
Tools
- perf_events: perf one-liners, examples, visualizations.
- perf-tools: perf analysis tools using ftrace (github).
- bcc: perf analysis tools using eBPF (github).
- ktap: one-liners, examples, and scripts.
- Flame Graphs: using perf, SystemTap, and ktap.
Documentation
- Linux Performance Analysis in 60,000 Millisecondsshows the first ten commands to use in an investigation (video, PDF). Written by myself and the performance engineering team at Netflix (2015).
- My post Performance Tuning Linux Instances on EC2includes the tunables we’re using at Netflix (2015).
- A gdb Debugging Full Example (Tutorial), including the use of some perf/debugging tools (2016).
- Posts about eBPF and bcc (2015-6):Linux eBPF bcc: Taming Linux 4.3+ Tracing Superpowers tcpconnect and tcpaccept for Linux (bcc) Linux eBPF Stack Trace Hack (bcc) Linux eBPF Off-CPU Flame Graph (bcc) Linux Wakeup and Off-Wake Profiling (bcc) Linux chain graph prototype (bcc) Linux eBPF/bcc uprobes Linux BPF/bcc Road Ahead Ubuntu Xenial bcc/BPF Linux bcc/BPF Tracing Security Capabilities Linux MySQL Slow Query Tracing with bcc/BPF Linux bcc/BPF ext4 Latency Tracing Linux bcc/BPF Run Queue (Scheduler) Latency Linux bcc/BPF Node.js USDT Tracing Linux bcc tcptop Linux 4.9’s Efficient BPF-based Profiler DTrace for Linux 2016 Linux 4.x Tracing Tools: Using BPF Superpowers Linux bcc/BPF tcplife: TCP Lifespans
- A post about Linux 4.7 Hist Triggers (2016).
- My lwn.net article Ftrace: The Hidden Light Switch shows a use case for Linux ftrace (Aug, 2014).
- Posts about ftrace-based perf-tools (2014-5):iosnoop for Linux
- ,
- ,
- ,
- ,
- ,
- ,
- ,
- Posts about perf-based perf-tools: perf Hacktogram.
- Posts about perf_events (2014-5):perf CPU Sampling
- ,
- ,
- ,
- ,
- ,
- ,
- ,
- (
- )
- The blog post strace Wow Much Syscall discusses strace(1) for production use, and compares it to advanced tracing tools (2014).
- USE Method: Linux Performance Checklist; also see the USE Method page for the description of this methodology.
- Systems Performance: Enterprise and the Cloud (Prentice Hall, 2013) uses Linux distributions as the primary example.
Talks
In recommended viewing order:1. Linux Systems Performance (PerconaLive 2016)
This is my summary of Linux systems performance in 50 minutes, covering six facets: observability, methodologies, benchmarking, profiling, tracing, and tuning. It’s intended for people who have limited appetite for this topic. A video of the talk is on percona.com, and the slides are on slideshare or as a PDF. For a lot more information on observability tools, profiling, and tracing, see the talks that follow.2. Linux Performance Tools (Velocity 2015)
At Velocity 2015, I gave a 90 minute tutorial on Linux performance tools, summarizing performance observability, benchmarking, tuning, static performance tuning, and tracing tools. I also covered performance methodology, and included some live demos. This should be useful for everyone working on Linux systems. If you just saw my PerconaLive2016 talk, then some content should be familiar, but with many extras: I focus a lot more on the tools in this talk. A video of the talk is on youtube (playlist; part 1, part 2) and the slides are on slideshare or as a PDF. This was similar to my SCaLE11x and LinuxCon talks, however, with 90 minutes I was able to cover more tools and methodologies, making it the most complete tour of the topic I’ve done. I also posted about it on the Netflix Tech Blog.3. Broken Linux Performance Tools (SCaLE14x, 2016)
At the Southern California Linux Expo (SCaLE 14x), I gave a talk on Broken Linux Performance Tools. This was a follow-on to my earlier Linux Performance Tools talk originally at SCaLE11x (and more recently at Velocity as a tutorial). This broken tools talk was a tour of common problems with Linux system tools, metrics, statistics, visualizations, measurement overhead, and benchmarks. It also includes advice on how to cope (the green “What You Can Do” slides). A video of the talk is on youtube and the slides are on slideshare or as a PDF.4. Linux Profiling at Netflix (SCaLE13x, 2015)
At (SCaLE 13x), I gave a talk on Linux Profiling at Netflix using perf_events (aka “perf”), covering CPU profiling and a tour of other features. This talk covered gotchas, such as fixing stack traces and symbols when profiling Java and Node.js. A video of the talk is on youtube, and the slides are on slideshare or as a PDF. In a post about this talk, I included the interactive CPU flame graph SVG I was demonstrating.5. Linux Performance Analysis: New Tools and Old Secrets (ftrace) (LISA 2014)
At USENIX LISA 2014, I gave a talk on the new ftrace and perf_events tools I’ve been developing: the perf-tools collection on github, which mostly uses ftrace: a tracer that has been built into the Linux kernel for many years, but few have discovered (practically a secret). A video of the talk is on youtube, and the slides are on slideshare or as a PDF. The perf-tools collection, inspired by my earlier DTraceToolkit, provides advanced system performance analysis tools for Linux. Each tool has a man page and example file. They are unstable and unsupported, and they currently use shell scripting, hacks, and the ftrace and perf_events kernel tracing frameworks. They should be developed (and improved) as the Linux kernel acquires more tracing capabilities (eg, eBPF). In a post about this talk, I included some more screenshots of these tools in action.6. Linux 4.x Performance: Using BPF Superpowers (Performance @Scale 2016)
This talk introduced new Linux performance analysis capabilities in the Linux 4.x series, using BPF. This was the first session for the 2016 Performance @Scale conference at Facebook. A video of the talk is on facebook, and the slides are on slideshare or as a PDF.Click for video of: Linux 4.x Performance: Using BPF Superpowers (Brendan Gregg)Posted by At Scale on Friday, February 26, 2016
7. Performance Checklists for SREs (SREcon, 2016)
At SREcon 2016 Santa Clara, I gave the closing talk on performance checklists for SREs (Site Reliability Engineers). The later half of this talk included Linux checklists for incident performance response. These may be useful whether you’re analyzing Linux performance in a hurry or not. A video of the talk is on youtube and usenix, and the slides are on slideshare and as a PDF. I included the checklists in a blog post.8. What Linux can learn from Solaris performance and vice-versa (SCaLE12x, 2014)
At SCaLE 12x, I gave the keynote on What Linux can learn from Solaris performance and vice-versa. This drew on my prior experiences doing head to head comparisons, and work for the Systems Performance book. I’d never seen a good talk comparing performance features of both, I suspect in part because it’s hard to know them both in enough depth, and also hard to choose from the many differences which should be highlighted. A video of the talk is on youtube, and the slides are on slideshare and as a PDF. This presentation also contains ponies. Lots of ponies. These are the unofficial mascots for DTrace, perf_events, SystemTap, ktap, and LTTng, and were designed by the same person (Deirdré) who designed the original (and popular) DTrace ponycorn.Resources
Other resources (not by me) I’d recommend for the topic of Linux performance:- Performance analysis & tuning of Red Hat Enterprise Linux – 2015 Red Hat Summit (video 2hrs): this is a great and in-depth tour of Linux performance tuning that should be largely applicable to all Linux distros.
- Linux Instrumentation: slides from a great talk in June 2010 by Ian Munsie, which summarizes the different Linux tracers very well. If you’re trying to understand all the tracers and frameworks, this is worth studying (keeping in mind it’s from 2010).
- Julia Evans blog has many posts about many topics, including performance tools.